| .circleci | ||
| .github/workflows | ||
| qurator | ||
| tests | ||
| .gitignore | ||
| CHANGELOG.md | ||
| LICENSE | ||
| Makefile | ||
| ocrd-tool.json | ||
| README.md | ||
| requirements-test.txt | ||
| requirements.txt | ||
| setup.py | ||
Eynollah
Perform document layout analysis (segmentation) from image data and return the results as PAGE-XML.
Installation
pip install . or
pip install -e . for editable installation
Alternatively, you can also use make with these targets:
make install or
make install-dev for editable installation
The current version of Eynollah runs on Python >=3.6 with Tensorflow >=2.4.
In order to use a GPU for inference, the CUDA toolkit version 10.x needs to be installed.
Models
In order to run this tool you need trained models. You can download our pretrained models from qurator-data.de.
Alternatively, running make models will download and extract models to $(PWD)/models_eynollah.
Training
In case you want to train your own model to use with Eynollah, have a look at sbb_pixelwise_segmentation.
Usage
The command-line interface can be called like this:
eynollah \
-i <image file name> \
-o <directory to write output xml or enhanced image> \
-m <directory of models> \
-fl <if true, the tool will perform full layout analysis> \
-ae <if true, the tool will resize and enhance the image and produce the resulting image as output. The rescaled and enhanced image will be saved in output directory> \
-as <if true, the tool will check whether the document needs rescaling or not> \
-cl <if true, the tool will extract the contours of curved textlines instead of rectangle bounding boxes> \
-si <if a directory is given here, the tool will output image regions inside documents there> \
-sd <if a directory is given, deskewed image will be saved there> \
-sa <if a directory is given, all plots needed for documentation will be saved there> \
-tab <if true, this tool will try to detect tables> \
-ib <in general, eynollah uses RGB as input but if the input document is strongly dark, bright or for any other reason you can turn binarized input on. This option does not mean that you have to provide a binary image, otherwise this means that the tool itself will binarized the RGB input document> \
-ho <if true, this tool would ignore headers role in reading order detection> \
-sl <if a directory is given, plot of layout will be saved there> \
-ep <if true, the tool will be enabled to save desired plot. This should be true alongside with -sl, -sd, -sa , -si or -ae options>
The tool performs better with RGB images than greyscale/binarized images.
Documentation
click to expand/collapse
Region types
click to expand/collapse
Eynollah can currently be used to detect the following region types/elements:
In addition, the tool can detect the ReadingOrder of regions. The final goal is to feed the output to an OCR model.
Method description
click to expand/collapse
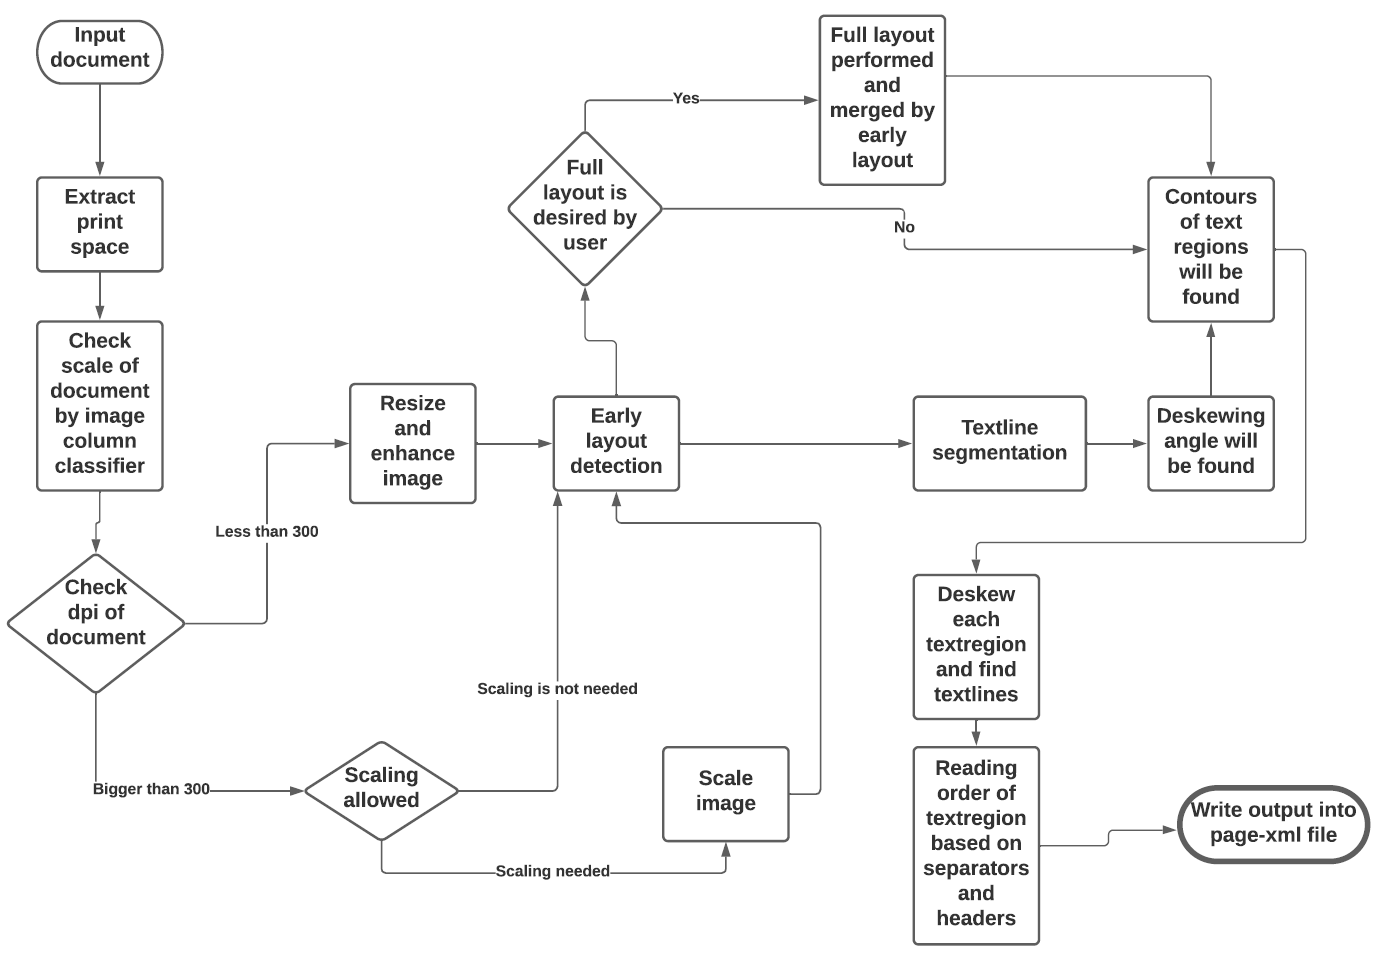
Eynollah uses a combination of various models and heuristics (see flowchart below for the different stages and how they interact):
- Border detection
- Layout detection
- Textline detection
- Image enhancement
- Scale classification
- Heuristic methods
The first three stages are based on pixel-wise segmentation.
Border detection
For the purpose of text recognition (OCR) and in order to avoid noise being introduced from texts outside the printspace, one first needs to detect the border of the printed frame. This is done by a binary pixel-wise-segmentation model trained on a dataset of 2,000 documents where about 1,200 of them come from the dhSegment project (you can download the dataset from here) and the remainder having been annotated in SBB. For border detection, the model needs to be fed with the whole image at once rather than separated in patches.
Layout detection
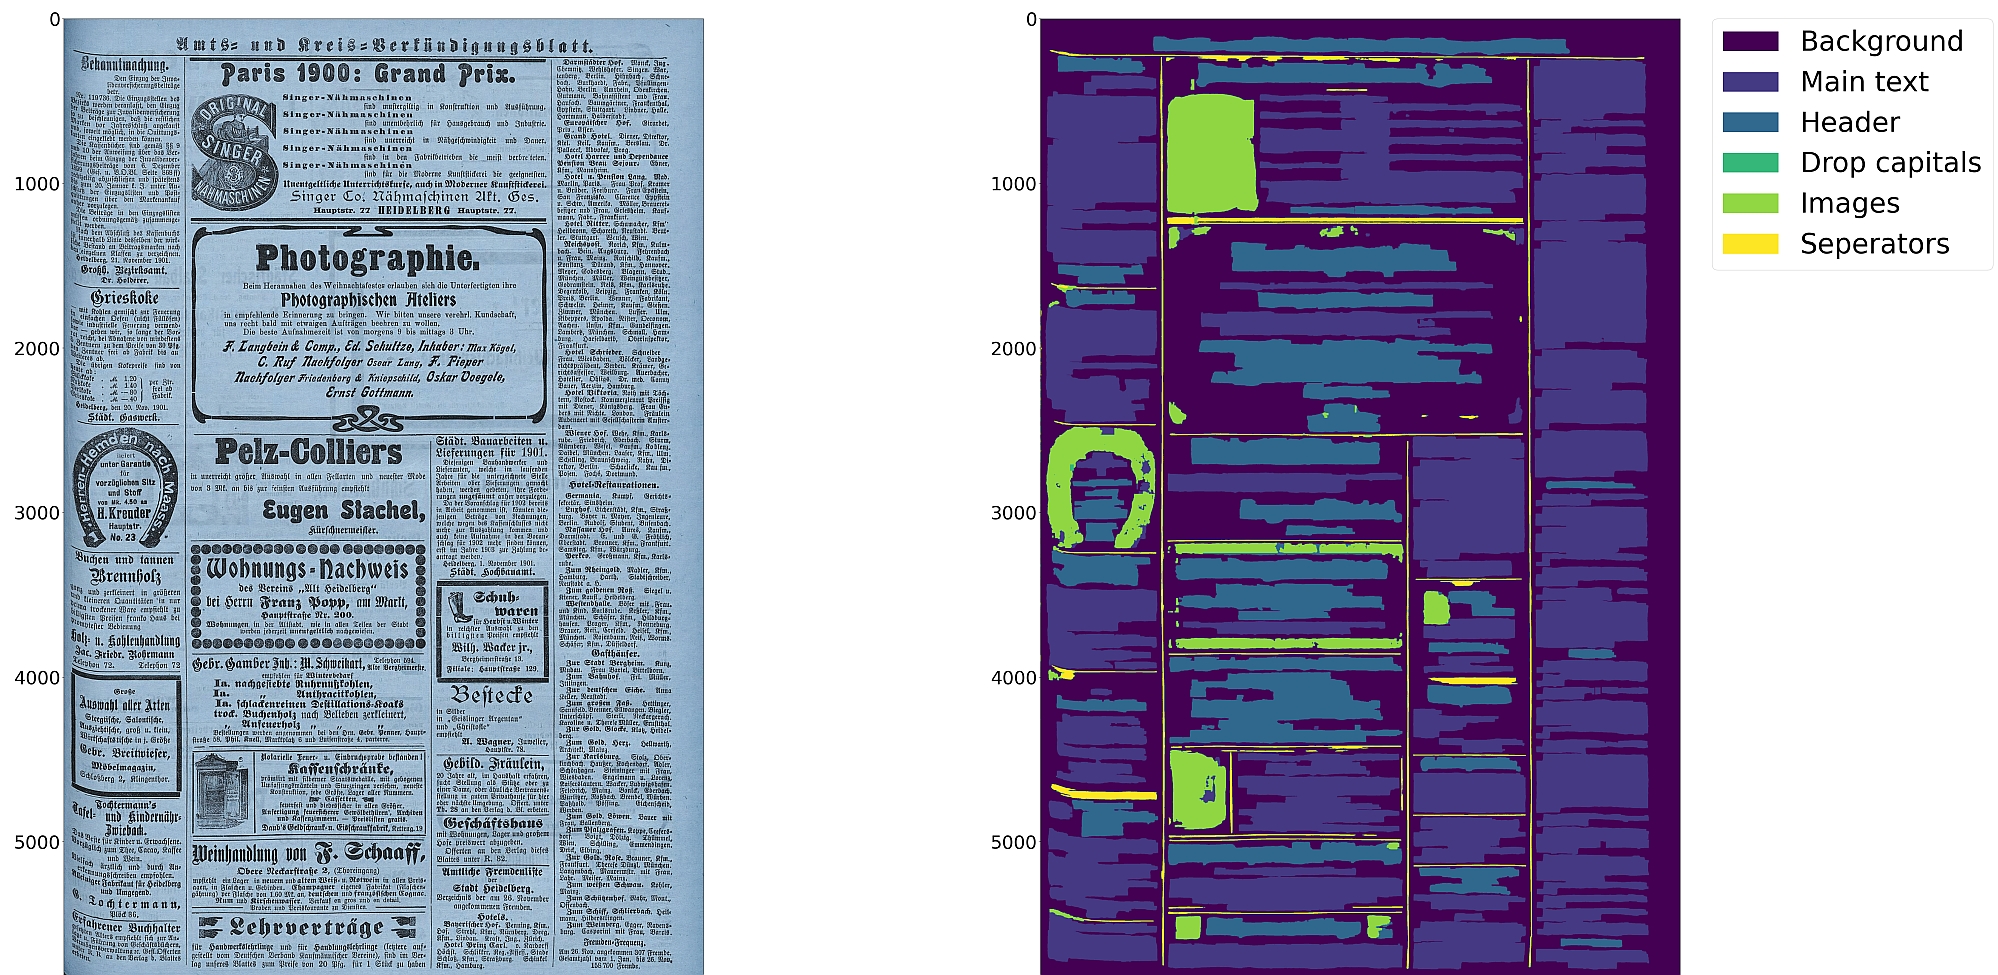
As a next step, text regions need to be identified by means of layout detection. Again a pixel-wise segmentation model was trained on 131 labeled images from the SBB digital collections, including some data augmentation. Since the target of this tool are historical documents, we consider as main region types text regions, separators, images, tables and background - each with their own subclasses, e.g. in the case of text regions, subclasses like header/heading, drop capital, main body text etc. While it would be desirable to detect and classify each of these classes in a granular way, there are also limitations due to having a suitably large and balanced training set. Accordingly, the current version of this tool is focussed on the main region types background, text region, image and separator.
Textline detection
In a subsequent step, binary pixel-wise segmentation is used again to classify pixels in a document that constitute textlines. For textline segmentation, a model was initially trained on documents with only one column/block of text and some augmentation with regard to scaling. By fine-tuning the parameters also for multi-column documents, additional training data was produced that resulted in a much more robust textline detection model.
Image enhancement
This is an image to image model which input was low quality of an image and label was actually the original image. For this one we did not have any GT, so we decreased the quality of documents in SBB and then feed them into model.
Scale classification
This is simply an image classifier which classifies images based on their scales or better to say based on their number of columns.
Heuristic methods
Some heuristic methods are also employed to further improve the model predictions:
-
After border detection, the largest contour is determined by a bounding box, and the image cropped to these coordinates.
-
For text region detection, the image is scaled up to make it easier for the model to detect background space between text regions.
-
A minimum area is defined for text regions in relation to the overall image dimensions, so that very small regions that are noise can be filtered out.
-
Deskewing is applied on the text region level (due to regions having different degrees of skew) in order to improve the textline segmentation result.
-
After deskewing, a calculation of the pixel distribution on the X-axis allows the separation of textlines (foreground) and background pixels.
-
Finally, using the derived coordinates, bounding boxes are determined for each textline.
Model description
click to expand/collapse
Coming soon
How to use
click to expand/collapse
First, this model makes use of up to 9 trained models which are responsible for different operations like size detection, column classification, image enhancement, page extraction, main layout detection, full layout detection and textline detection.That does not mean that all 9 models are always required for every document. Based on the document characteristics and parameters specified, different scenarios can be applied.
-
If none of the parameters is set to
true, the tool will perform a layout detection of main regions (background, text, images, separators and marginals). An advantage of this tool is that it tries to extract main text regions separately as much as possible. -
If you set
-ae(allow image enhancement) parameter totrue, the tool will first check the ppi (pixel-per-inch) of the image and when it is less than 300, the tool will resize it and only then image enhancement will occur. Image enhancement can also take place without this option, but by setting this option totrue, the layout xml data (e.g. coordinates) will be based on the resized and enhanced image instead of the original image. -
For some documents, while the quality is good, their scale is very large, and the performance of tool decreases. In such cases you can set
-as(allow scaling) totrue. With this option enabled, the tool will try to rescale the image and only then the layout detection process will begin. -
If you care about drop capitals (initials) and headings, you can set
-fl(full layout) totrue. With this setting, the tool can currently distinguish 7 document layout classes/elements. -
In cases where the document includes curved headers or curved lines, rectangular bounding boxes for textlines will not be a great option. In such cases it is strongly recommended setting the flag
-cl(curved lines) totrueto find contours of curved lines instead of rectangular bounding boxes. Be advised that enabling this option increases the processing time of the tool. -
To crop and save image regions inside the document, set the parameter
-si(save images) to true and provide a directory path to store the extracted images. -
This tool is actively being developed. If problems occur, or the performance does not meet your expectations, we welcome your feedback via issues.
--full-layout vs --no-full-layout
Here are the difference in elements detected depending on the --full-layout/--no-full-layout command line flags:
--full-layout |
--no-full-layout |
|
|---|---|---|
| reading order | x | x |
| header regions | x | - |
| text regions | x | x |
| text regions / text line | x | x |
| drop-capitals | x | - |
| marginals | x | x |
| marginals / text line | x | x |
| image region | x | x |
Use as OCR-D processor
Eynollah ships with a CLI interface to be used as OCR-D processor. In this case, the source image file group with (preferably) RGB images should be used as input like this:
ocrd-eynollah-segment -I OCR-D-IMG -O SEG-LINE -P models
In fact, the image referenced by @imageFilename in PAGE-XML is passed on directly to Eynollah as a processor, so that e.g. calling
ocrd-eynollah-segment -I OCR-D-IMG-BIN -O SEG-LINE -P models
would still use the original (RGB) image despite any binarization that may have occured in previous OCR-D processing steps
Eynollah "light"
TODO