2020-11-30 15:40:32 +01:00
# Eynollah
2022-03-28 13:15:35 +02:00
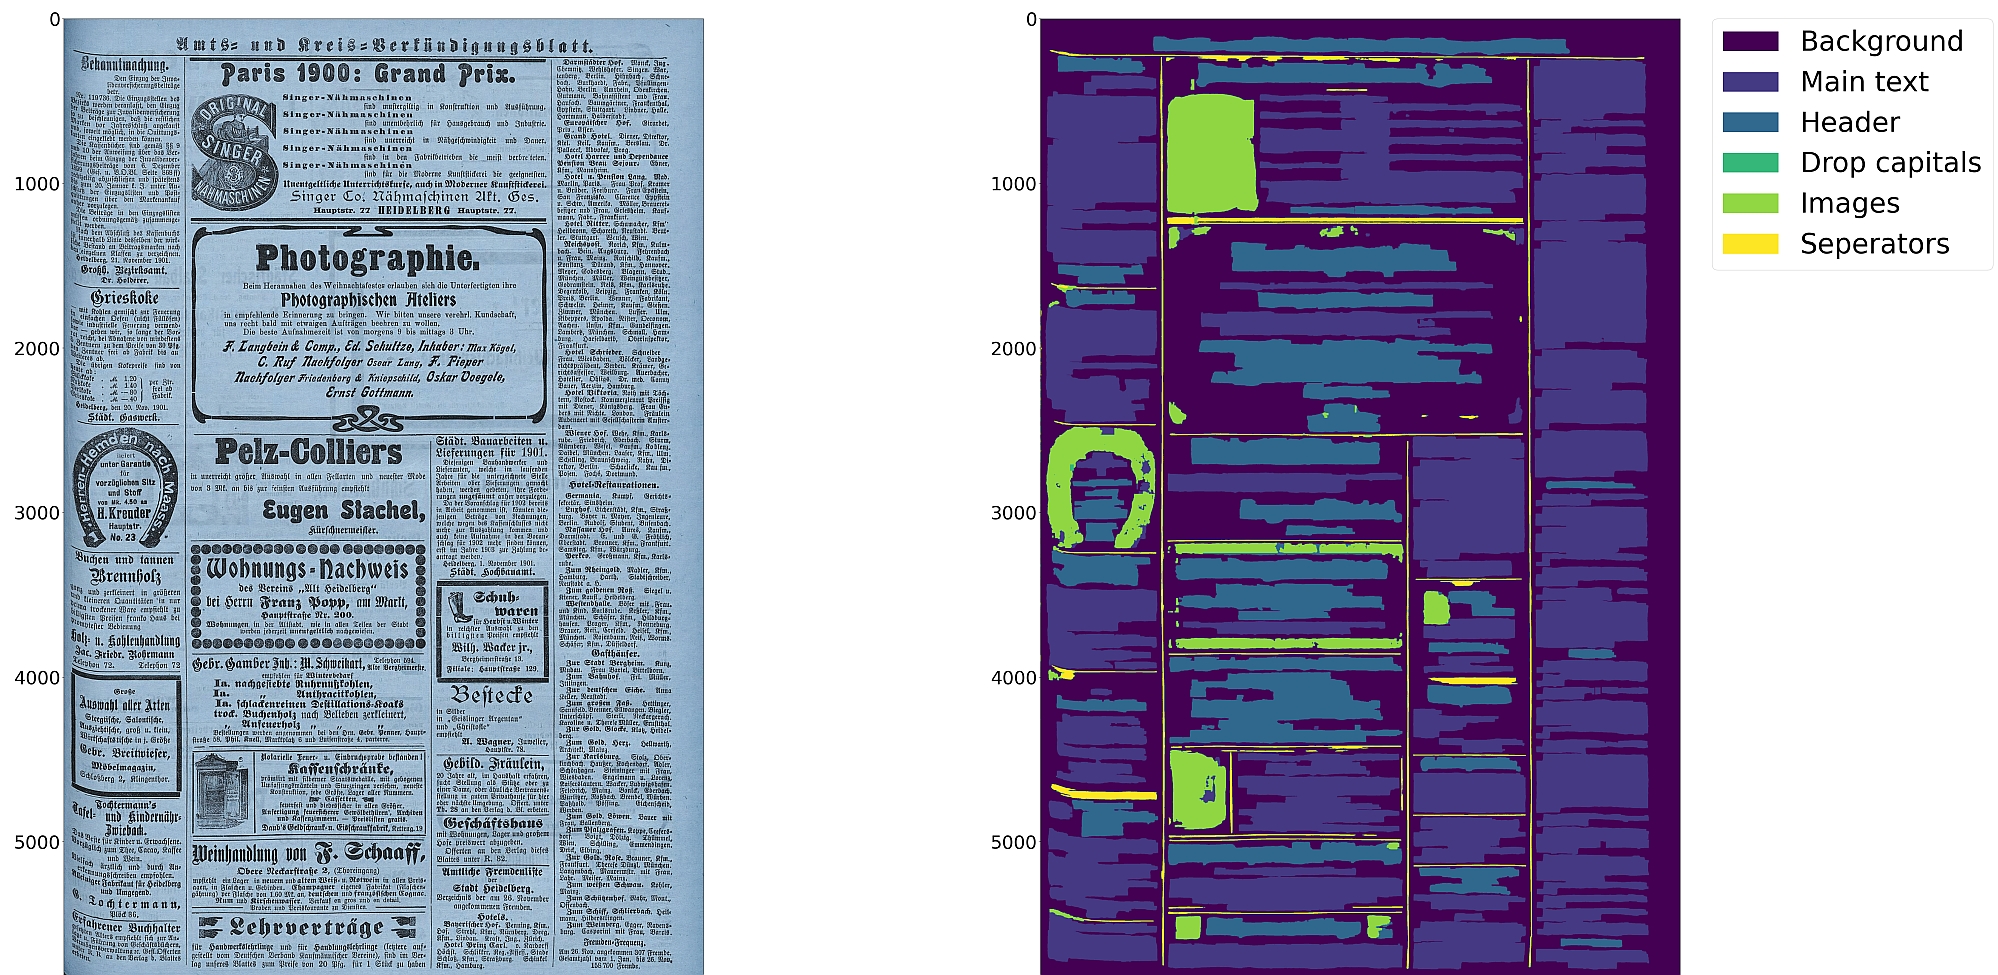
> Perform document layout analysis (segmentation) from image data and return the results as [PAGE-XML](https://github.com/PRImA-Research-Lab/PAGE-XML).
2020-11-20 12:49:27 +01:00
2020-12-16 15:52:37 +01:00
2020-11-20 12:49:27 +01:00
## Installation
2020-12-16 15:52:37 +01:00
`pip install .` or
`pip install . -e` for editable installation
Alternatively, you can also use `make` with these targets:
`make install` or
`make install-dev` for editable installation
2020-11-20 12:49:27 +01:00
### Models
2020-11-20 17:37:35 +01:00
2022-03-28 13:15:35 +02:00
In order to run this tool you need trained models. You can download our pretrained models from [qurator-data.de ](https://qurator-data.de/eynollah/ ).
2020-11-20 12:49:27 +01:00
2020-12-16 15:52:37 +01:00
Alternatively, running `make models` will download and extract models to `$(PWD)/models_eynollah` .
2022-03-28 13:15:35 +02:00
### Training
In case you want to train your own model to use with Eynollah, have a look at [sbb_pixelwise_segmentation ](https://github.com/qurator-spk/sbb_pixelwise_segmentation ).
2020-11-20 12:49:27 +01:00
## Usage
2022-03-28 13:15:35 +02:00
The command-line interface can be called like this:
2020-11-20 12:49:27 +01:00
2020-12-16 15:52:37 +01:00
```sh
eynollah \
-i < image file name > \
-o < directory to write output xml or enhanced image > \
-m < directory of models > \
-fl < if true , the tool will perform full layout analysis > \
2021-07-10 07:28:31 -04:00
-ae < if true , the tool will resize and enhance the image and produce the resulting image as output . The rescaled and enhanced image will be saved in output directory > \
2020-12-16 15:52:37 +01:00
-as < if true , the tool will check whether the document needs rescaling or not > \
-cl < if true , the tool will extract the contours of curved textlines instead of rectangle bounding boxes > \
2021-07-10 07:31:15 -04:00
-si < if a directory is given here , the tool will output image regions inside documents there > \
-sd < if a directory is given , deskewed image will be saved there > \
-sa < if a directory is given , all plots needed for documentation will be saved there > \
-tab < if true , this tool will try to detect tables > \
-ib < in general , eynollah uses RGB as input but if the input document is strongly dark , bright or for any other reason you can turn binarized input on . This option does not mean that you have to provide a binary image , otherwise this means that the tool itself will binarized the RGB input document > \
-ho < if true , this tool would ignore headers role in reading order detection > \
-sl < if a directory is given , plot of layout will be saved there > \
2021-07-10 07:28:31 -04:00
-ep < if true , the tool will be enabled to save desired plot . This should be true alongside with -sl , -sd , -sa , -si or -ae options >
2020-12-16 15:52:37 +01:00
```
2020-11-20 12:49:27 +01:00
2022-03-28 13:15:35 +02:00
The tool performs better with RGB images than greyscale/binarized images.
2020-11-20 12:49:27 +01:00
2022-03-28 13:15:35 +02:00
Additional documentation can be found in the [wiki ](https://github.com/qurator-spk/eynollah/wiki ).